


Bearish Tri-Star Candlestick Pattern: In the world of technical analysis, candlestick patterns play a pivotal role in helping traders predict future price movements of securities. Each pattern contains significant information about the market’s direction. Among different candlestick patterns present, one such significant triple candlestick pattern is the “Bearish Tri-Star” candlestick pattern.
In this article, we will delve into the Bearish Tri-Star candlestick pattern, exploring its formation, psychology, and trading strategy with an example.
Bearish Tri-Star Candlestick Pattern – Meaning
A bearish tri-star is a bearish candlestick pattern that generally indicates a bearish reversal. This means that after its formation, the stock price will likely see a downward trend.

As the name suggests, this candlestick pattern consists of three consecutive doji candles. These candles close near their open price. It is preferable for this pattern to appear after a significant uptrend as in that situation it gives a stronger bearish momentum indication.
Note: If you want to learn Candlesticks and Chart Trading from Scratch, here’s the best book available on Amazon! Get the book now!


Bearish Tri-Star Candlestick Pattern – Formation
Not every three-red candlestick formation can be considered a bearish tri-star candlestick pattern. A few things must be fulfilled before a three-candlestick pattern can be considered a bearish tri-star and they are as follows:
- All three candles must be doji candles.
- The second doji candle must open with a gap up.
- The third doji candle must open with a gap down.
Bearish Tri-Star Candlestick Pattern – Psychology
The formation of this pattern generally shows a change in the market sentiment. As this pattern generally appears after an uptrend, the formation indicates a negative sentiment in that particular security. The first doji indicates indecisiveness in the buying and selling pressure.
Suddenly there is an increase in buying pressure causing the second candle to open with a gap up. But again there is equal buying and selling pressure. The gap down open of the third candle indicates that the selling pressure had increased between the second and third candle trading periods.
Hence, this third doji candle shows that more selling pressure is coming into the market and that is why the price can potentially see a bearish movement. Three doji candles also show a balance in buying and selling pressure over three periods, indicating that the buyers cannot push the price further up.
Bearish Tri-Star Candlestick Pattern – Trading Ideas
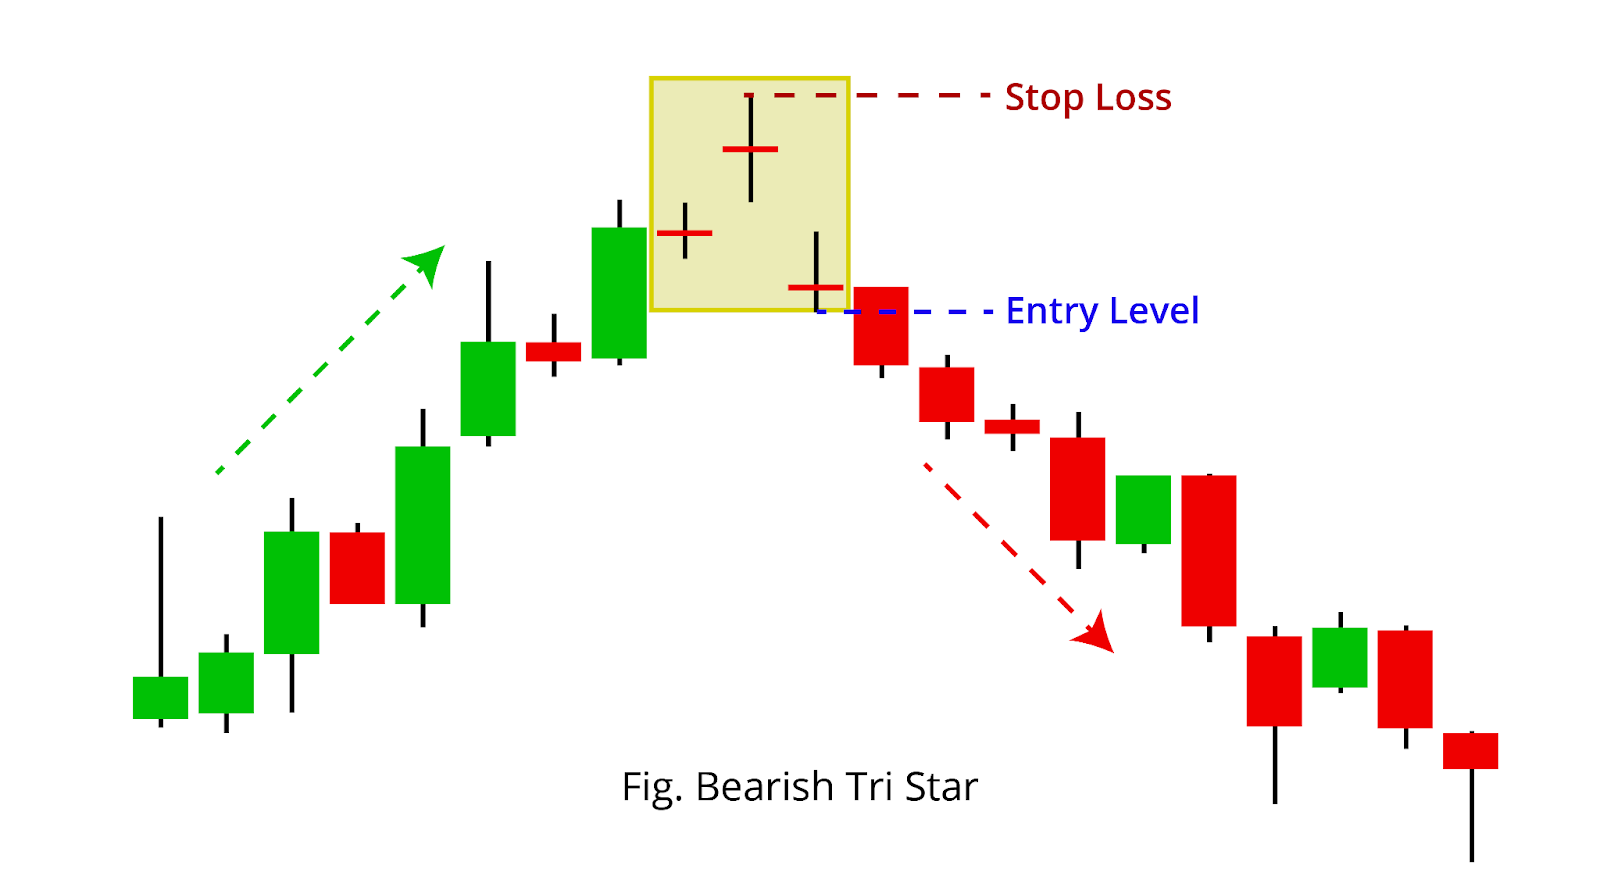
Traders must ensure that the prior trend before the formation of this pattern is an uptrend. Once this pattern is formed in an uptrend, the following are the guidelines to take a trade:
- Entry: When the price of the security goes below the low price of the third candle of this pattern, traders can take a short position.
- Target: Traders can exit the trade when the price of the security reaches the immediate support zone. Once this level is reached, one can also book partial profits in the trade and hold on to the remaining position until the next support level.
- Stoploss: Traders can place the stop loss near the high price of this pattern.
Also read…
Bearish Tri Star Candlestick pattern – Example

In the above chart of the RELIANCE INDS, we can observe the formation of the bearish tri-star candlestick pattern after an uptrend. As discussed above, the price of the stock saw a bearish movement after the formation of this pattern.
As the pattern is formed in the above chart, an entry to a short position at Rs. 2396.95 with a stop loss level at Rs 2430.25 can be placed for a downtrend movement.
Strength of the Bearish Tri-Star Candlestick Pattern
This pattern can form in any trend but the indication would have less probability of succeeding if it appears in a downtrend or sideways trend. Also, there are situations where the formation of this pattern will have a stronger indication with a higher probability of a bearish reversal.
- Formation after a long uptrend: The formation of this pattern after a significantly long uptrend will have a stronger bearish reversal indication as it shows that the buying pressure has come to exhaustion and the selling pressure has increased in the stock.
- Formation at a strong resistance zone: Resistance zones are created when the price of a stock has previously reacted to a particular price level. A strong resistance zone is formed when the price has reacted to that level multiple times. Therefore, if this pattern is observed within that zone, it suggests that the price has reacted again and is unlikely to move above that level.
Conclusion
The bearish tri-star candlestick pattern can appear in any market and generally indicates a bearish reversal. However, it is better to take a short trade only when the pattern appears in an uptrend. When it appears in an uptrend, it is historically observed to work better as a bearish reversal indication.
Traders should not rely solely on this pattern but also include other technical tools and indicators to confirm the price prediction. It is important to place a stop loss to minimise losses if the price of the stock moves against our analysis.
Written by Deepak
By utilizing the stock screener, stock heatmap, portfolio backtesting, and stock compare tool on the Trade Brains portal, investors gain access to comprehensive tools that enable them to identify the best stocks, also get updated with stock market news, and make well-informed investments.

Start Your Stock Market Journey Today!
Want to learn Stock Market trading and Investing? Make sure to check out exclusive Stock Market courses by FinGrad, the learning initiative by Trade Brains. You can enroll in FREE courses and webinars available on FinGrad today and get ahead in your trading career. Join now!!