


Candlestick patterns are essential tools in technical analysis, offering insights into potential market reversals and continuations. Among the less common but highly significant patterns is the “Bullish Hikkake” candlestick pattern. In this article, we shall explore the meaning, psychology, formation, and trading strategies of the Bullish Hikkake Candlestick pattern.
Bullish Hikkake Candlestick Pattern – Definition
The Hikkake pattern introduced by Daniel L Chesler is a Japanese-named pattern which means a ‘hook, trap’. This pattern is named as such as misleads the trades into entering false positions due to its series of candlestick bars which indicate a deceptive setup.
A bullish hikkake is a multi-candlestick pattern that generally indicates a short-term bullish trend. This means that after its formation, the stock price will likely see an upside movement for a period of time.

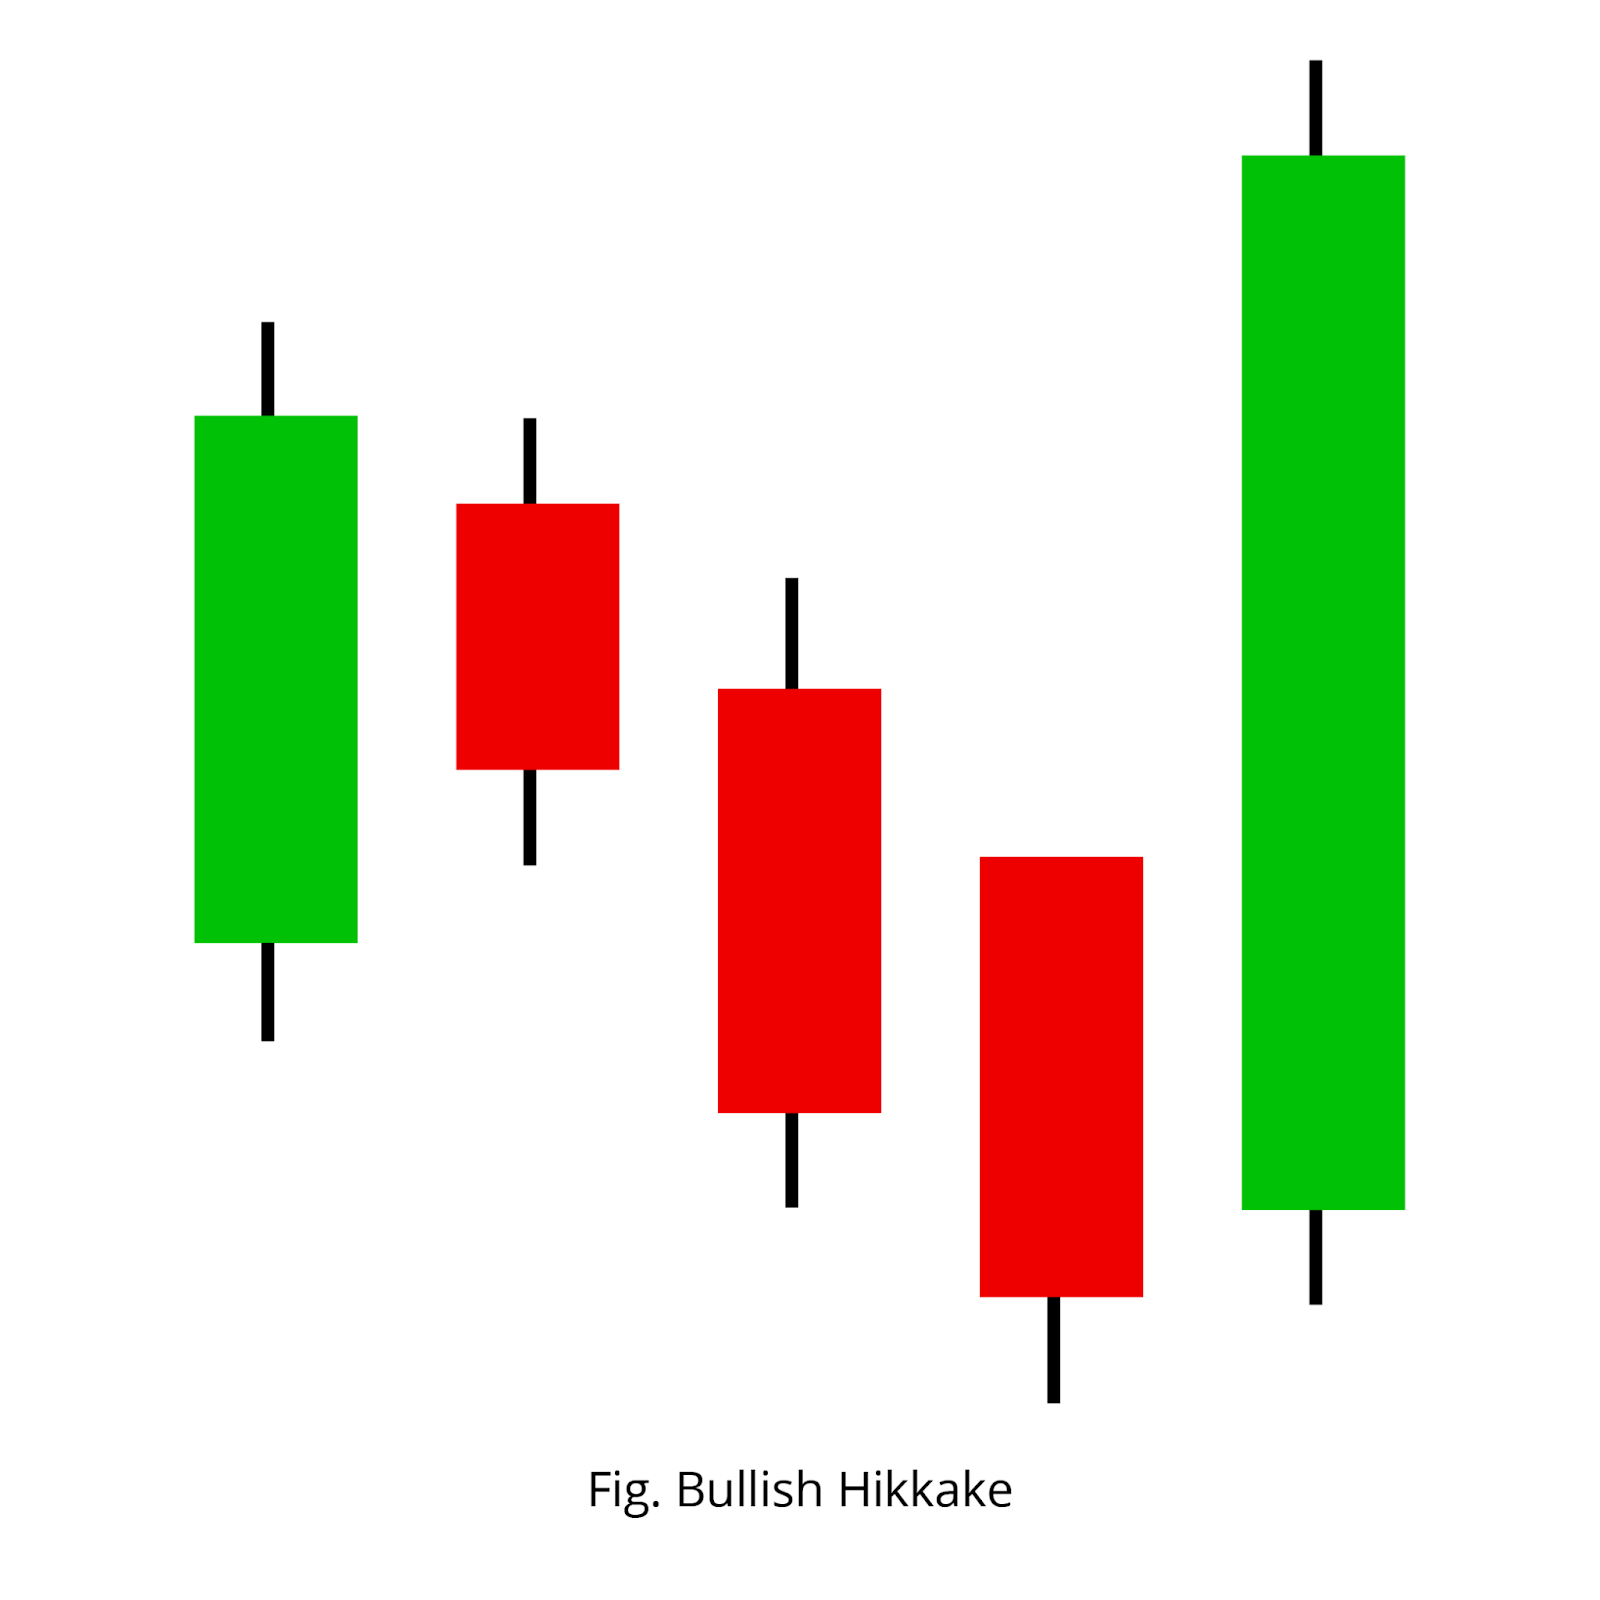
The candlestick pattern consists of five different candles. These candles in the pattern have two setups, the first two candles indicate a short-term downtrend movement and thereafter, the price makes a short-term upward move trapping the traders who have entered a short position.
Note: If you want to learn Candlesticks and Chart Trading from Scratch, here’s the best book available on Amazon! Get the book now!

Bullish Hikkake Candlestick Pattern – Formation
Spotting the bullish hikkake candlestick pattern would be challenging. So a few things must be fulfilled before the candlestick pattern can be considered a bullish hikkake and they are as follows:
- The first two candles form an inside candlestick pattern or a harami pattern where the first candle completely overshadows the body of the second candle.
- The third candle has a lower high and lower low compared to the second candle.
- The fourth closes below the third candle.
- The final candle is a green candle that closes above the high of the second candle.
Bullish Hikkake Candlestick Pattern – Psychology
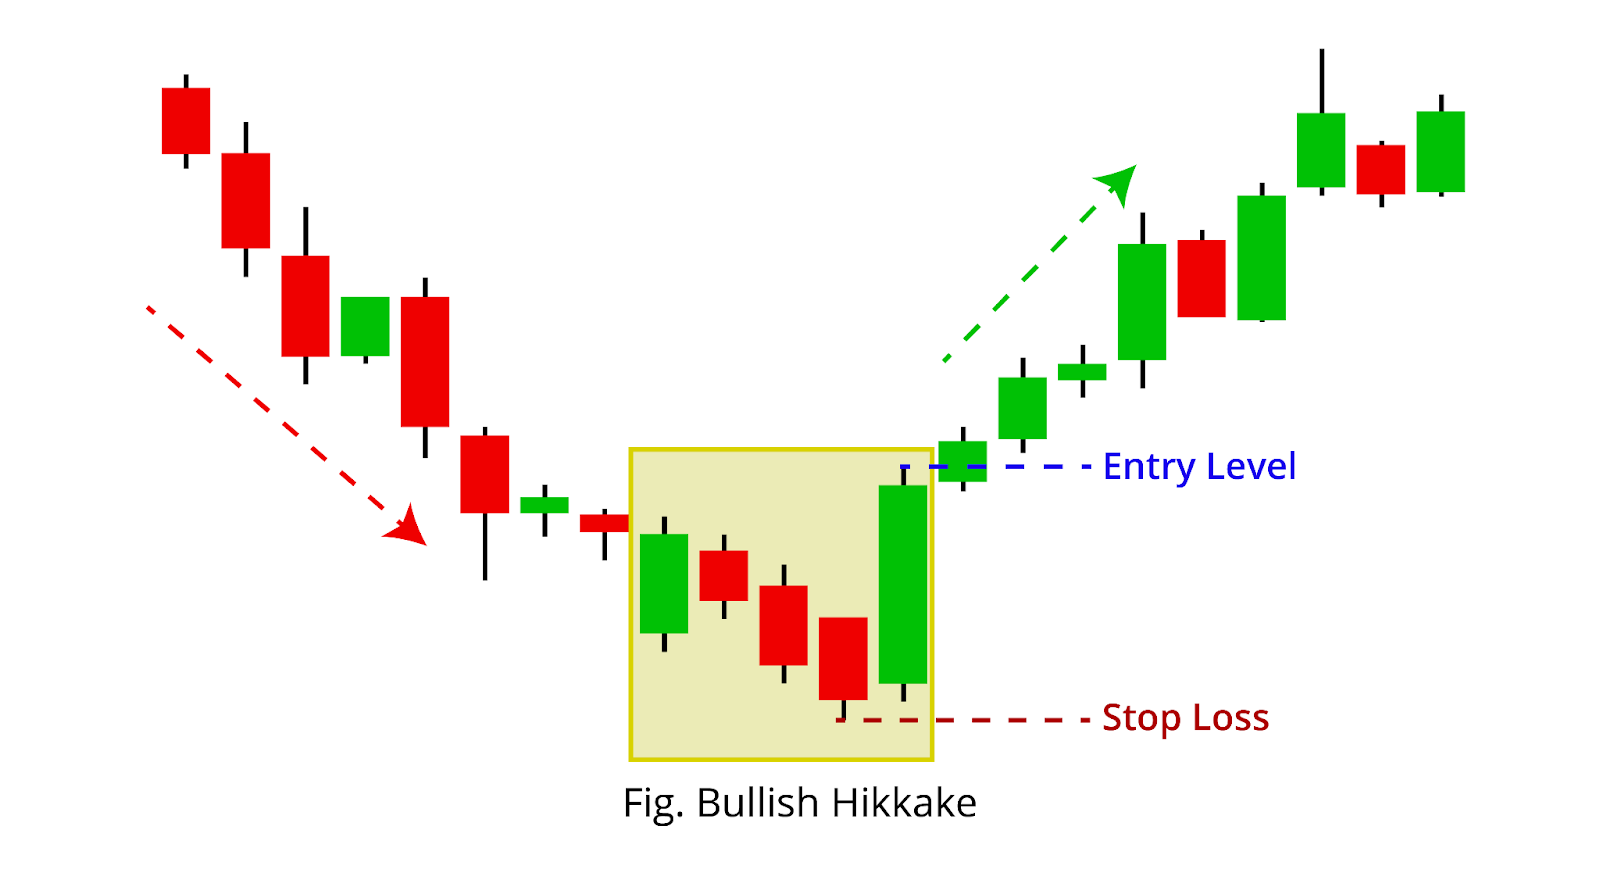
The formation of this pattern generally shows a change in the market sentiment. As this pattern generally appears after a downtrend, the formation indicates a positive sentiment in that particular security.
The first two candles of the pattern form a bearish harami pattern which indicates a short-term downtrend. The next red candle after the harami pattern suggests the continuation of the selling pressure where traders might enter a short position based on the harami pattern formed.
But the final candle of the hikkake pattern will be a large green candle which closes above the high of the harami pattern hitting all sellers’ stop loss. As the stop loss for the short positions is triggered, sellers close their position which helps the price to move further higher.
Bullish Hikkake Candlestick Pattern – Trading Ideas
Once this pattern is formed preferably after a downtrend, the following are the guidelines for taking a trade:
- ENTRY: When the last candle of the pattern closes above the high of the second candle, traders can take a long position in the security.
- TARGET: As this pattern is known for its short-term price reversals. traders can exit their trade based on the risk-to-reward ratio.
- STOP LOSS: Traders can place the stop loss near the low price of this pattern.
Also read…
Bullish Hikkake Candlestick Pattern – Example
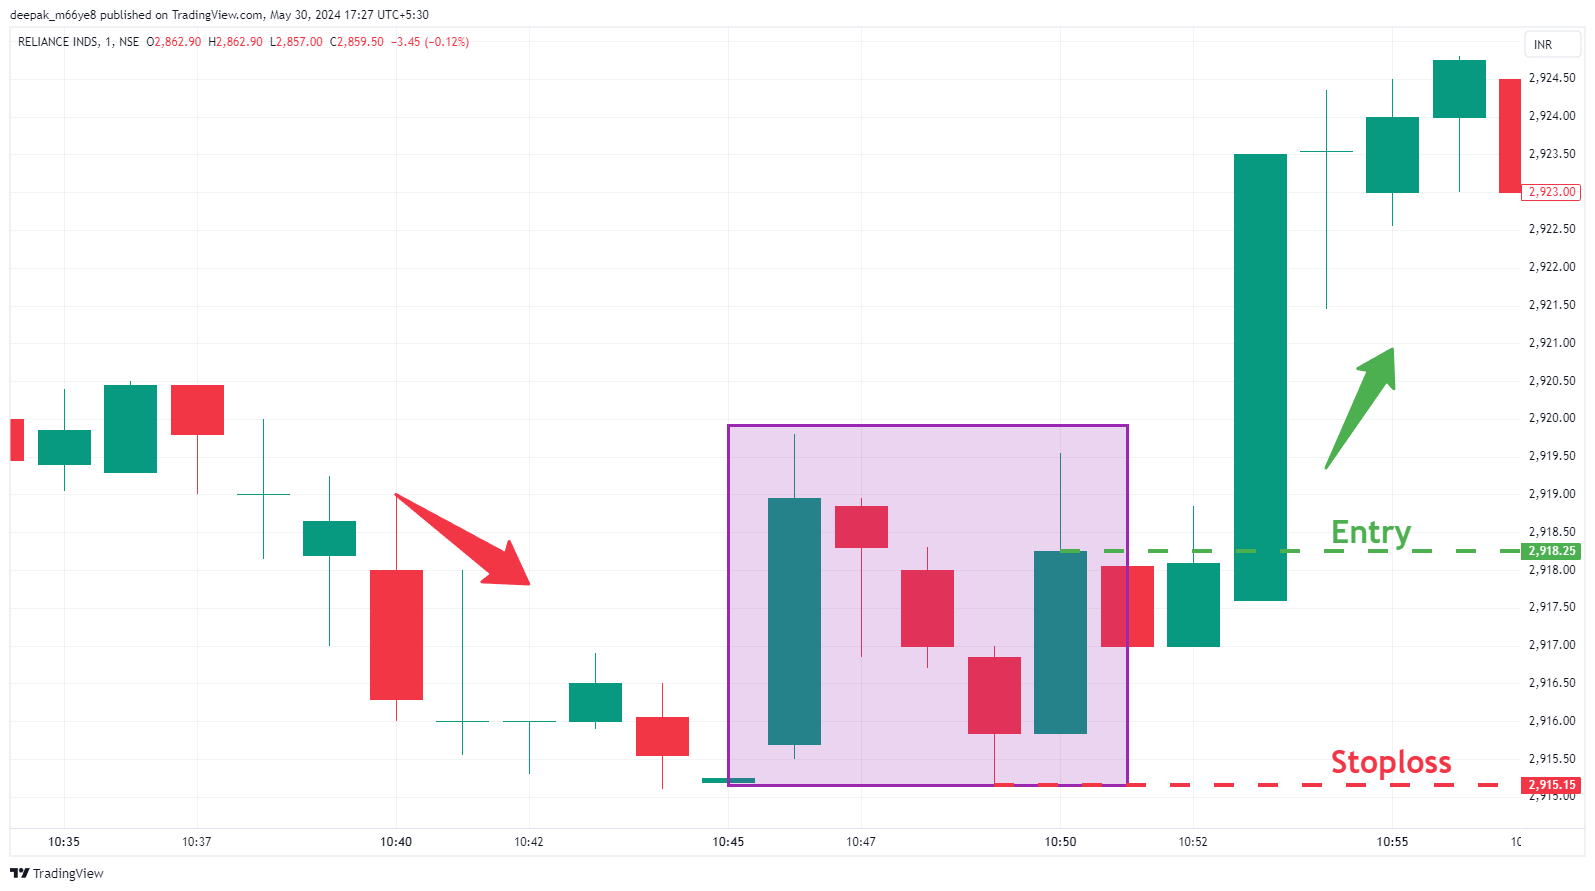
In the above chart of Reliance Industries, we can observe the formation of the bullish hikkake candlestick pattern. As discussed above, the price of the stock saw a bullish movement after the formation of this pattern.
As the pattern formation indicates a bullish trend, an entry at Rs 2918.25 with a stop loss level of Rs 2915.15 can be placed.
Limitations
The formation of a pattern helps in identifying trading opportunities, but it’s also important to understand its limitations for better risk management.
- The effectiveness of the Bullish Hikkake pattern may vary depending on market conditions, it can be more reliable in trending markets than in range-bound markets.
- The pattern takes five consecutive sessions (or candles). As a result, the market may already account for all the price action.
- Relying solely on the Bullish Hikkake pattern for trading decisions can be risky. It is advisable to use additional technical indicators, such as volume analysis or moving averages, to confirm the pattern.
Conclusion
The bullish hikkake candlestick pattern can appear in any market and generally indicates a bull trend. However, it is better to take a trade only when the pattern forms completely. Traders should not rely solely on this pattern but also include other technical tools and indicators to confirm the price prediction. It is important to place a stop loss to minimise losses if the price of the stock moves against our analysis.
Written by Deepak
By utilizing the stock screener, stock heatmap, portfolio backtesting, and stock compare tool on the Trade Brains portal, investors gain access to comprehensive tools that enable them to identify the best stocks, also get updated with stock market news, and make well-informed investments.

Start Your Stock Market Journey Today!
Want to learn Stock Market trading and Investing? Make sure to check out exclusive Stock Market courses by FinGrad, the learning initiative by Trade Brains. You can enroll in FREE courses and webinars available on FinGrad today and get ahead in your trading career. Join now!!