


Candlestick patterns play a crucial role in technical analysis and are utilized by traders to understand market sentiment and forecast potential price changes in securities. This piece delves into the Long Legged Doji Candlestick pattern, its significance, variations, and methods for integrating it into your trading approach.
Long Legged Doji candlestick pattern – Definition
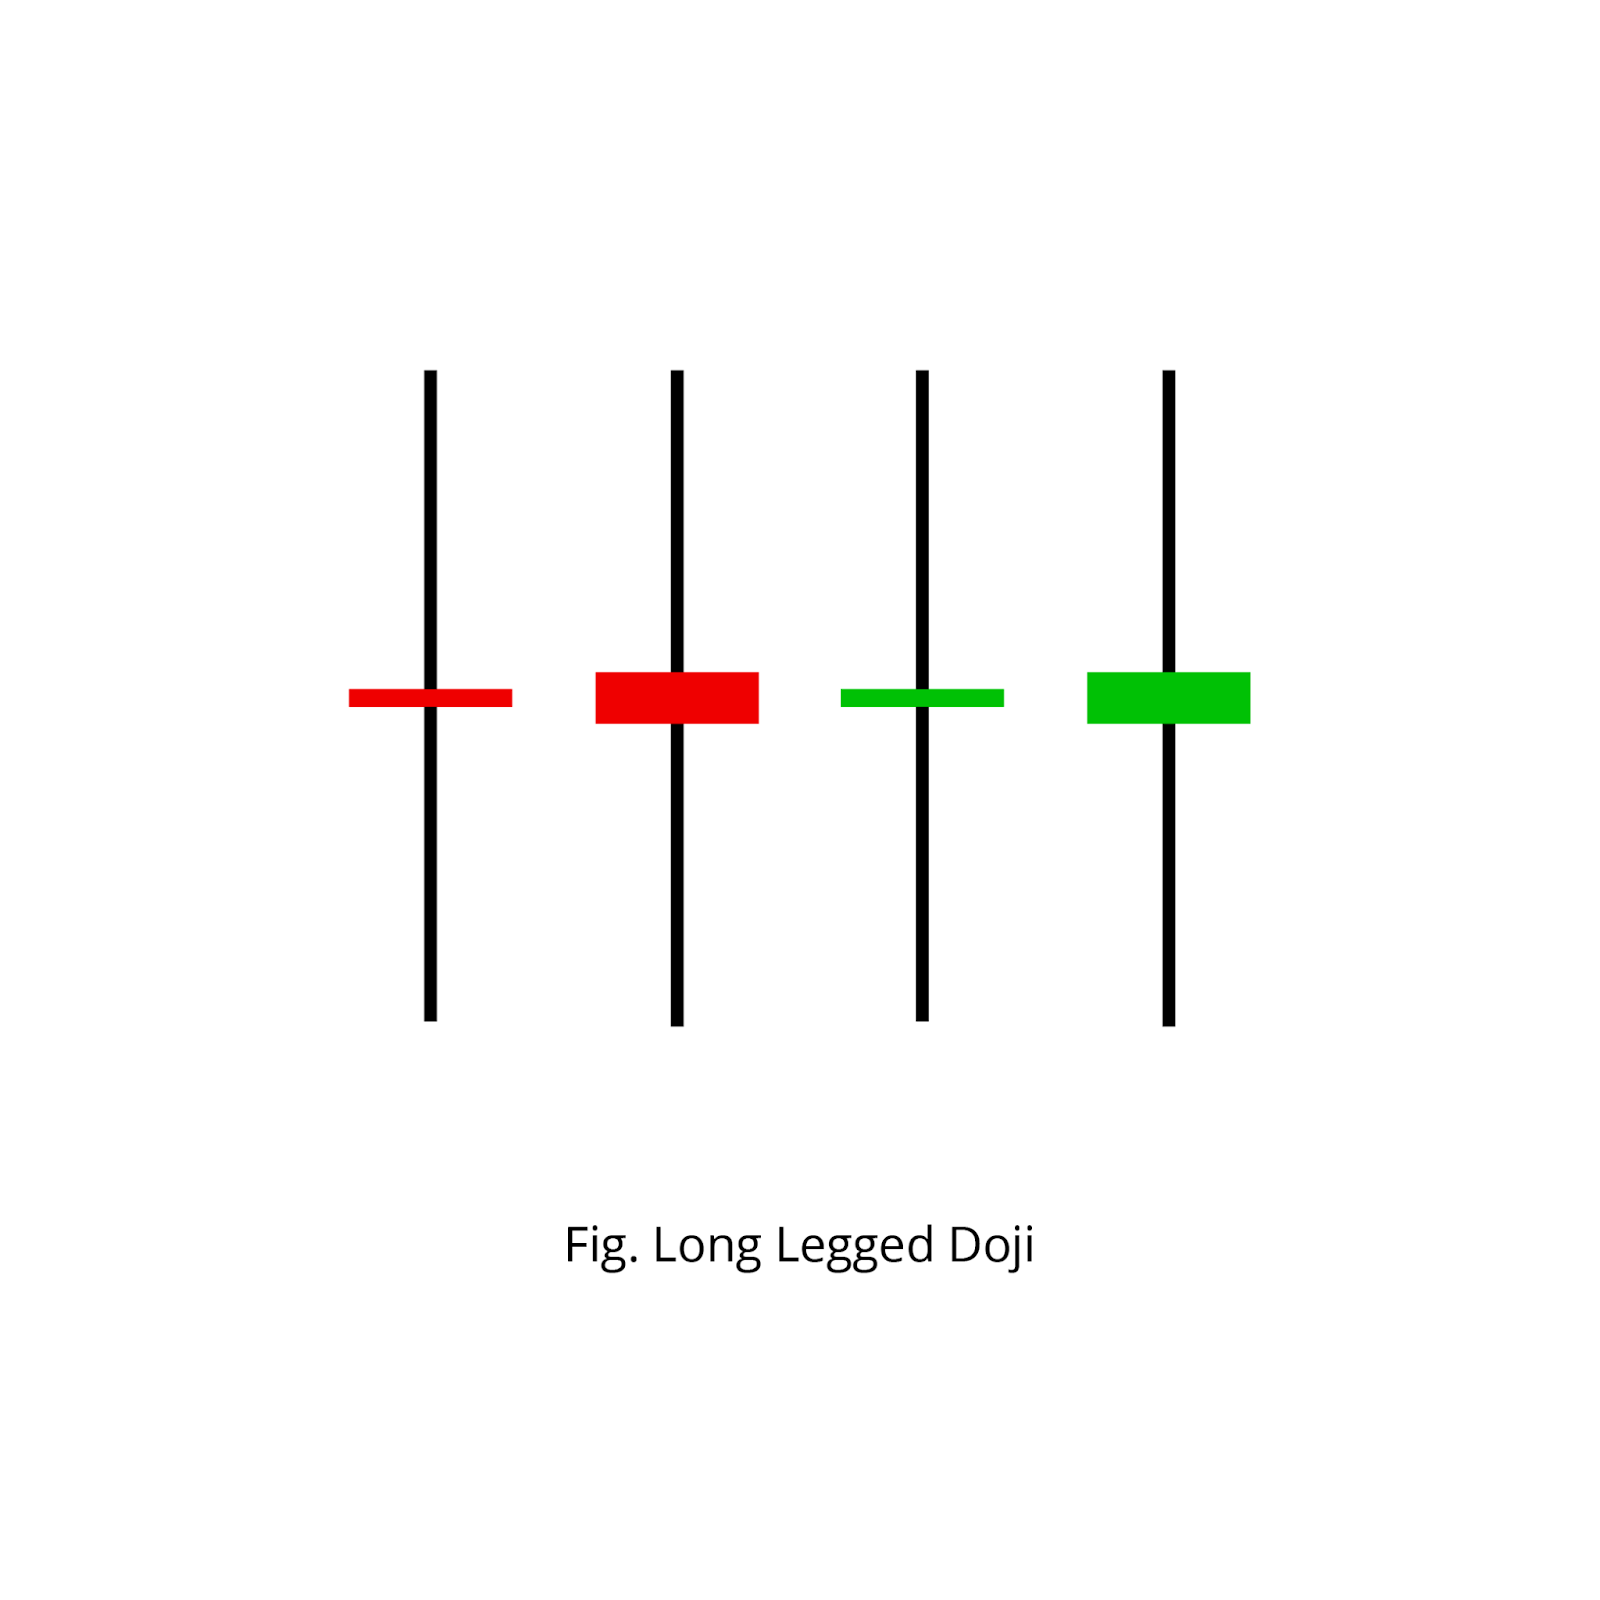
The Long Legged Doji is a candlestick pattern that indicates indecision in the market. It occurs when the opening and closing prices of a security are almost equal, resulting in a very small or non-existent body. The pattern resembles a cross or plus sign, with long upper and lower shadows.
This pattern suggests that neither buyers nor sellers have gained control, resulting in a standoff. The Long Legged Doji can appear in any trend and is often considered a potential reversal signal when found at the end of a strong uptrend or downtrend.
Long legged Doji Candlestick Pattern – Psychology
The psychology behind the Long Legged Doji pattern reflects a balance between bullish and bearish forces in the market. During the candlestick formation, both buyers and sellers exert equal pressure, causing the price to open and close at nearly the same level.
Note: If you want to learn Candlesticks and Chart Trading from Scratch, here’s the best book available on Amazon! Get the book now!
This equilibrium indicates uncertainty among market participants about the future direction of the security. The Long Legged Doji often signals a temporary halt in the current trend and may precede a potential reversal or continuation, depending on the price action of the security.
long legged Doji candlestick pattern – Trading Ideas
From the above understanding, it can be seen that after the formation of the pattern one can enter a position based on the confirmation candle.
Long Position
Entry: After the formation of the long legged doji pattern, if the next candle closes above the pattern, a long position can be placed.
Stop loss: Stop loss for the long position can be placed at the low of the long legged doji pattern formed.

Profit Target: The profit target can be set based on nearby resistance levels, or by using a predetermined risk-reward ratio.
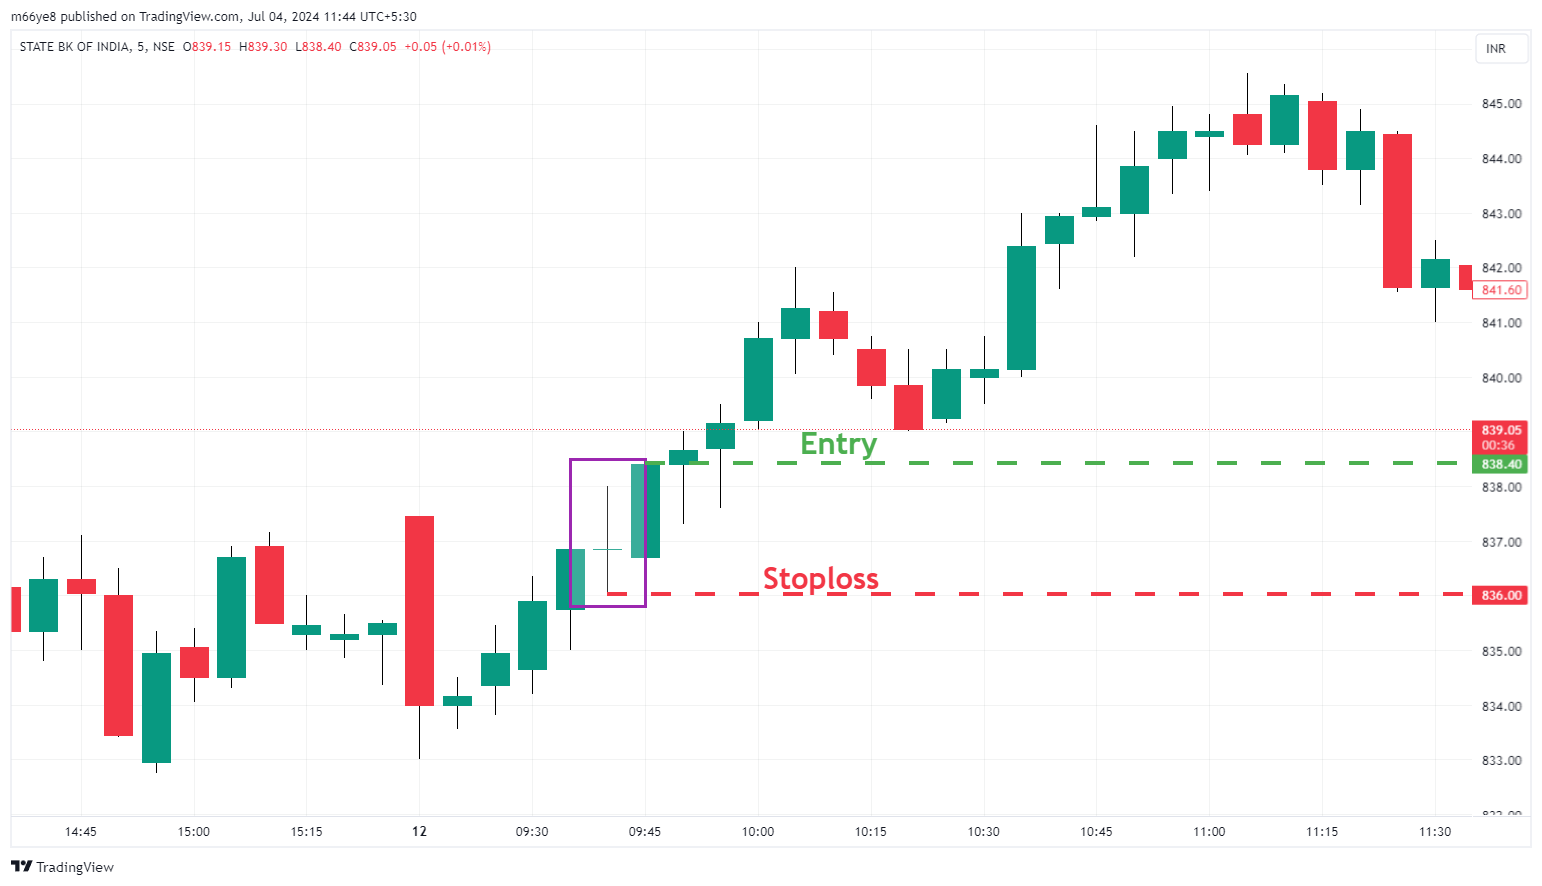
In the above chart of the State Bank of India, we can observe the formation of the Long Legged Doji candlestick pattern in an uptrend. As discussed in this article, the price saw a continuation in trend after the formation of the pattern.
At the time of the formation of this pattern, a trader could have taken a long position when the price of the stock started trading above Rs. 838.40 and the stop loss was at Rs. 836.
Short Position
Entry: After the formation of the long legged doji pattern, if the next candle closes below the pattern, a short position can be placed.
Stop loss: For the short position, it can be placed at the high of the long legged doji pattern formed.
Profit Target: The profit target can be set based on nearby support levels, or by using a predetermined risk-reward ratio.
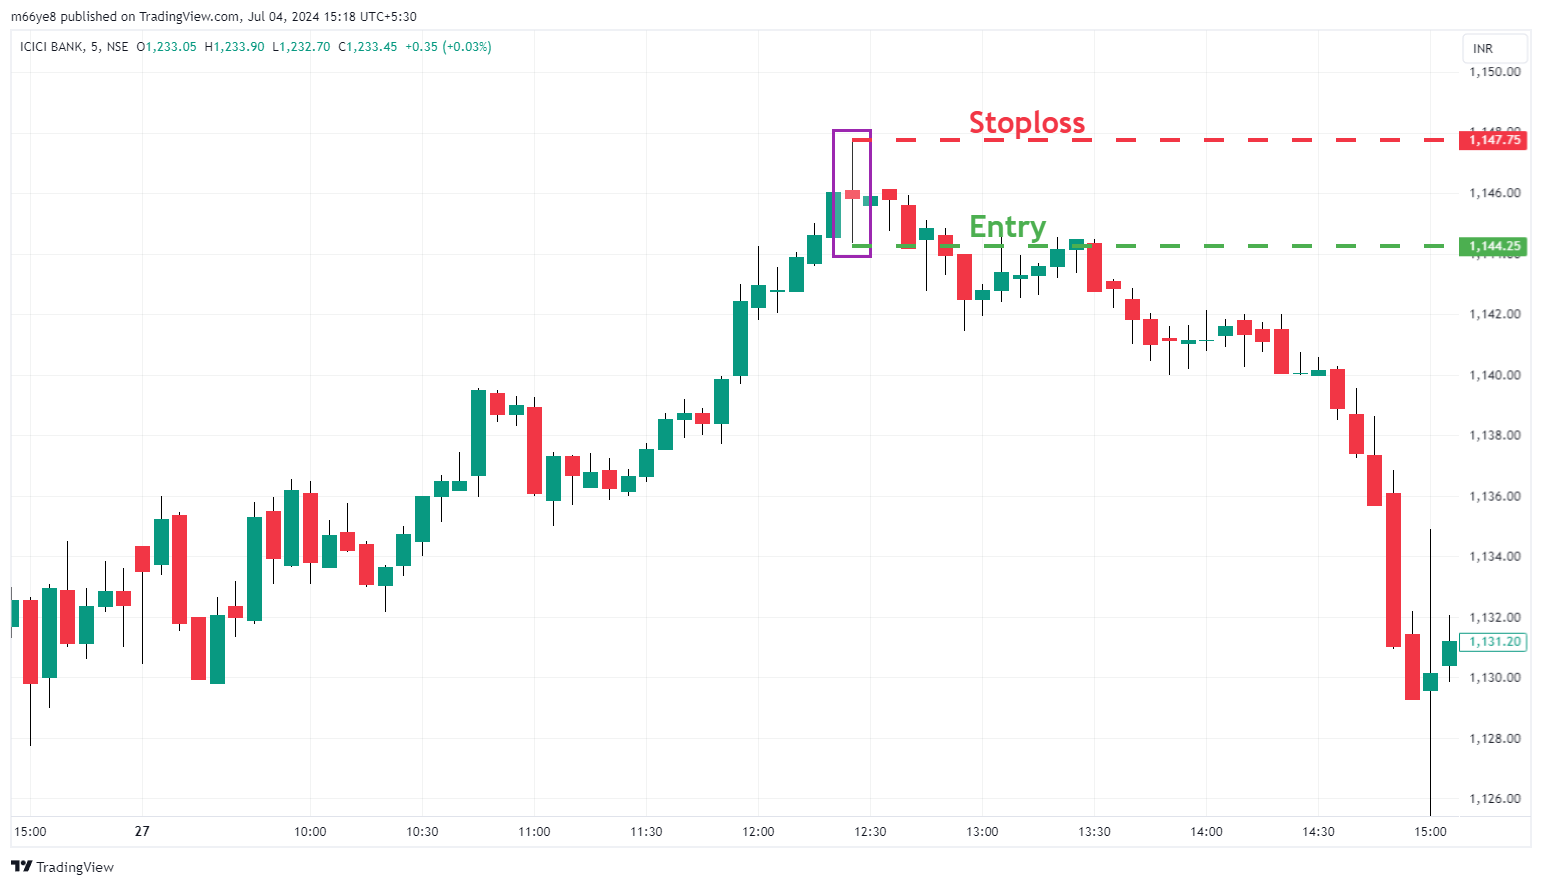
In the above chart of ICICI Bank, we can observe the formation of the long-legged Doji pattern in an uptrend. As discussed in this article, the price saw a change in trend after the formation of the pattern.
With the formation of this pattern, a trader could have taken a short position when the price traded below Rs. 1144.25 with a stop loss of Rs. 1147.25.
Also read…
Aspects to confirm the pattern
Consider the following criteria when identifying and confirming a long-legged Doji pattern:
1. The opening and closing prices should be very close or identical.
2. The pattern should have long upper and lower shadows.
3. The pattern’s significance increases when it appears after a strong trend or at key support/resistance levels.
4. Volume can provide additional confirmation, with higher volume suggesting stronger indecision.
Conclusion
The long-legged Doji candlestick pattern provides traders with a useful means to recognize periods of uncertainty in the market direction. By comprehending its psychology and combining it with other technical analysis, traders can make better-informed decisions regarding potential price actions.
Remember that while the long-legged Doji can serve as a potent signal, it should not be relied upon in isolation. Always consider various factors, such as trend analysis, support and resistance levels, and other technical indicators as a confirmation trade.
Written by Deepak
By utilizing the stock screener, stock heatmap, portfolio backtesting, and stock compare tool on the Trade Brains portal, investors gain access to comprehensive tools that enable them to identify the best stocks, also get updated with stock market news, and make well-informed investments.

Start Your Stock Market Journey Today!
Want to learn Stock Market trading and Investing? Make sure to check out exclusive Stock Market courses by FinGrad, the learning initiative by Trade Brains. You can enroll in FREE courses and webinars available on FinGrad today and get ahead in your trading career. Join now!!