


Understanding the significance of candlestick patterns for technical analysis is crucial since they provide valuable insights into the price movements of securities. We will explore the significance, psychology, and trading approaches associated with the spinning top candlestick pattern among the various available candlestick patterns.
Spinning Top candlestick pattern – Definition
The spinning top is a candlestick pattern that signals market indecision. It is characterised by a small real body of green or red colour with long upper and lower wicks. The spinning top can appear in both bullish and bearish contexts, and it often signals a potential trend reversal or consolidation period. Traders use the spinning top to identify areas of market uncertainty and potential changes in the prevailing trend.
This pattern suggests that neither the bulls nor the bears were able to gain control during the trading session, as the price fluctuated but ultimately closed near the opening price.

Spinning Top Candlestick Pattern – Psychology
The spinning top candlestick pattern reflects market indecision and a balance between buyers and sellers. It forms when the price fluctuates but ultimately closes near the opening price, indicating neither bulls nor bears could gain control during the trading session.
Note: If you want to learn Candlesticks and Chart Trading from Scratch, here’s the best book available on Amazon! Get the book now!
The long upper and lower wicks suggest high volatility as both sides fought for dominance, but the small real body shows they cancelled each other out. This pattern often signals a potential trend reversal or consolidation period, as the market pauses to determine the next direction.
Spinning Top candlestick pattern – Trading Ideas
Based on the above understandings, traders can enter a position after the pattern forms, using the next confirmation candle as a signal.
Long Position
Entry: After the formation of the spinning top pattern, if the next candle closes above the pattern, a long position can be placed.
Stop loss: Stop loss for the long position can be placed at the low of the spinning top pattern formed.

Profit Target: The profit target can be set based on nearby resistance levels or by using a predetermined risk-reward ratio.
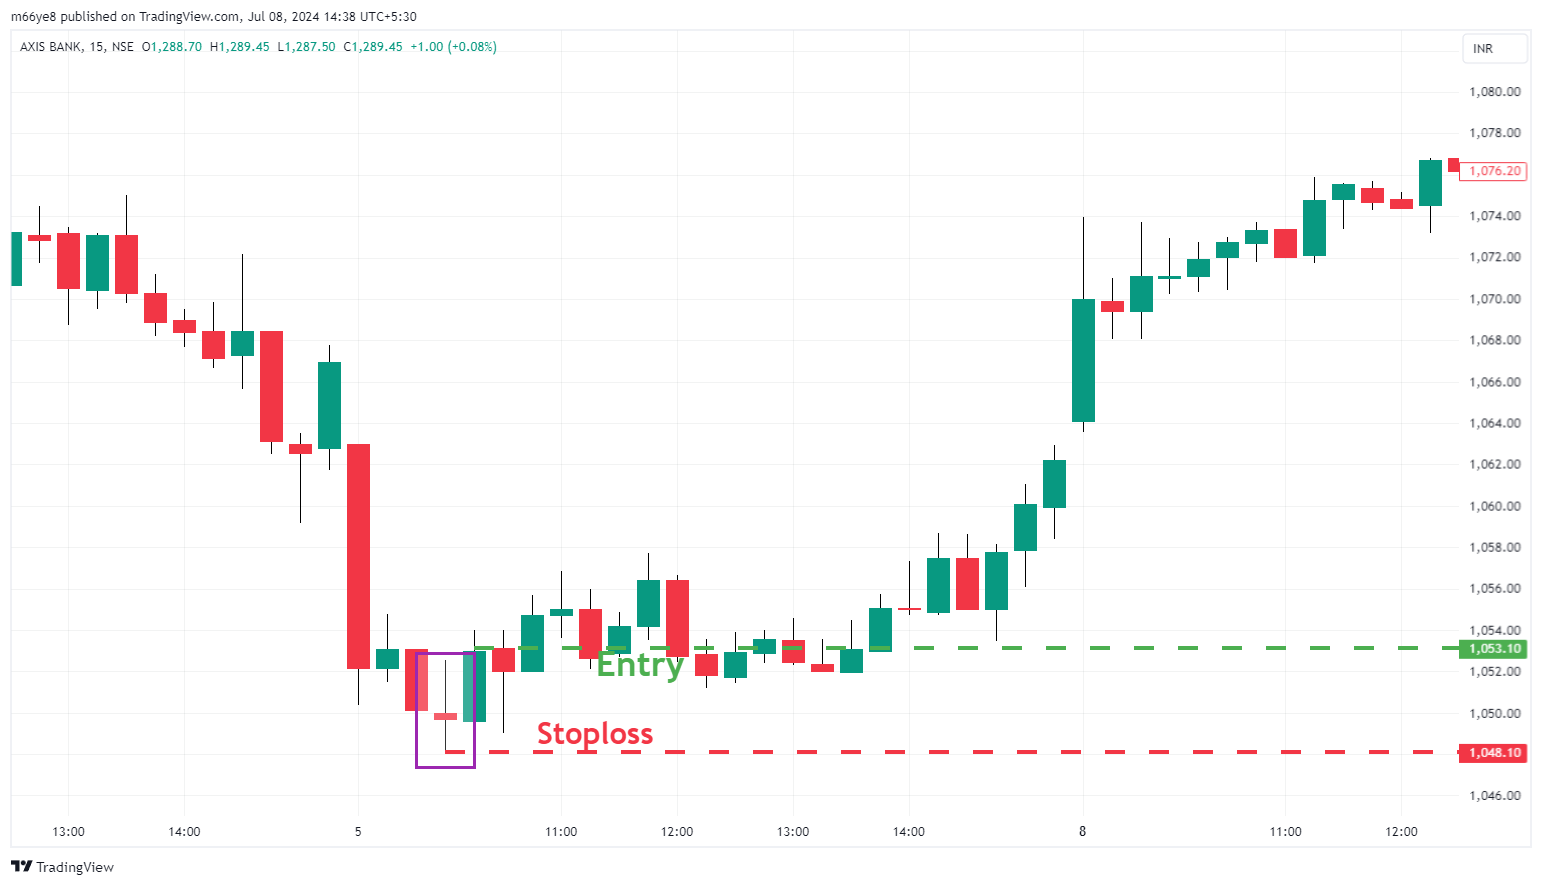
In the above chart of Axis Bank, we can observe the formation of the spinning top in a downtrend. As discussed in this article, the price saw a change in trend after the formation of the pattern.
At the time of the formation of this pattern, a trader could have taken a long position when the price of the stock started trading above Rs. 1053.10 and the stop loss was at Rs. 1048.10.
Short Position
Entry: After the spinning top pattern forms, a trader can enter a long position if the next candle closes above the pattern.
Stop loss: Stop loss for the short position can be placed at the high of the spinning top pattern formed.
Profit Target: The profit target can be set based on nearby support levels, or by using a predetermined risk-reward ratio.
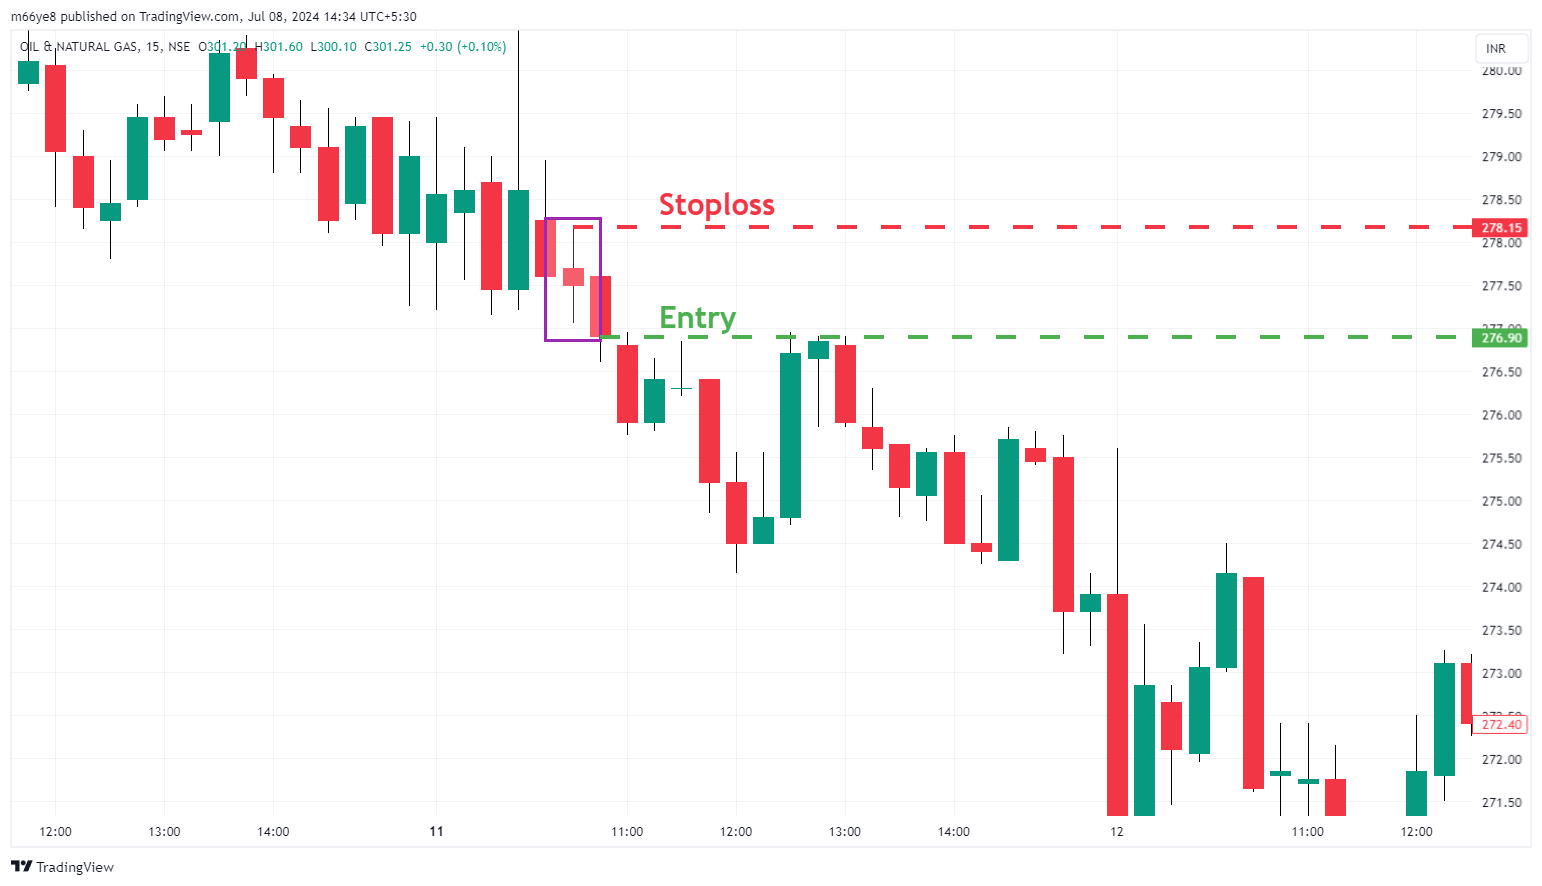
In the above chart of ONGC, we can observe the formation of the spinning top candlestick pattern in a downtrend.
When this pattern formed, a trader could have taken a short position as the stock price fell below Rs. 276.90, setting a stop loss at Rs. 278.15.
The pattern shows clear indecision in the security, allowing traders to anticipate either a trend continuation or reversal. Traders can then enter a position once they receive confirmation of the security’s direction
Limitations of Spinning Top candlestick pattern
While the spinning top candlestick pattern signals the indecision present, traders should also be aware of its limitations:
- The spinning top pattern can produce false signals (sometimes with low volumes), leading to losses.
- The effectiveness of the pattern may vary depending on market conditions.
- The pattern formation range-bound markets are often not so reliable.
Also read…
Conclusion
The spinning top pattern is a useful instrument for traders to recognize periods of uncertainty present in the market. By understanding its formation and combining it with other tools, traders can spot correct trade opportunities.
Also, effective risk management, combined with favourable risk-reward ratios, enables traders to achieve greater profitability over the long term.
Written by Deepak
By utilizing the stock screener, stock heatmap, portfolio backtesting, and stock compare tool on the Trade Brains portal, investors gain access to comprehensive tools that enable them to identify the best stocks, also get updated with stock market news, and make well-informed investments.

Start Your Stock Market Journey Today!
Want to learn Stock Market trading and Investing? Make sure to check out exclusive Stock Market courses by FinGrad, the learning initiative by Trade Brains. You can enroll in FREE courses and webinars available on FinGrad today and get ahead in your trading career. Join now!!