


Candlestick patterns are the key technical tool for traders to understand price movements. The patterns formed on candlestick charts over a given time frame offer potential views on trend reversals, continuations, or indecision in the market. In this article, we will delve into the Bullish Engulfing Candlestick pattern, exploring its meaning, characteristics, and strategies with the example of charts.
Bullish Engulfing Candlestick Pattern – Meaning
The bullish engulfing is a candlestick pattern that signals a potential reversal from a bearish to a bullish trend. It consists of two candlesticks, where the second candle completely engulfs the body of the first, smaller bearish candle.
The bullish engulfing pattern is considered a strong buy signal, as it suggests increased buying pressure and the likelihood of the upward trend continuing. Recognising this pattern can help traders identify favourable long-sided entry positions on market reversals.
Bullish Engulfing Candlestick Pattern – Formation
The Bullish Engulfing pattern indicates a reversal after a downtrend. This candlestick pattern comprises the following candles:
Note: If you want to learn Candlesticks and Chart Trading from Scratch, here’s the best book available on Amazon! Get the book now!
- The first candle must be bearish and the second candle must be bullish.
- The second candle must open below the close of the first candle.
- The second candle must close above the open of the first candle.
- The range (high and low) of the second candle must completely engulf the range of the first candle.
Bullish Engulfing Candlestick Pattern – Psychology
The bullish engulfing candlestick pattern forms at the bottom of a downtrend and indicates a potential reversal to an uptrend. It consists of a small bearish candle followed by a larger bullish candle that completely engulfs the previous candle.
This pattern suggests a shift in sentiment, as the market opens lower but buying pressure emerges, pushing prices higher and closing above the prior day’s open. The engulfing candle’s large size and its coverage of the entire range of the previous candle demonstrate the bulls’ strength and their ability to overpower the bears, hinting at the possibility of a sustained upward move.
Bullish Engulfing Candlestick Pattern – Trading Ideas
Once the Bullish Engulfing pattern is formed, traders can find entry opportunity to enter a long position in a security.
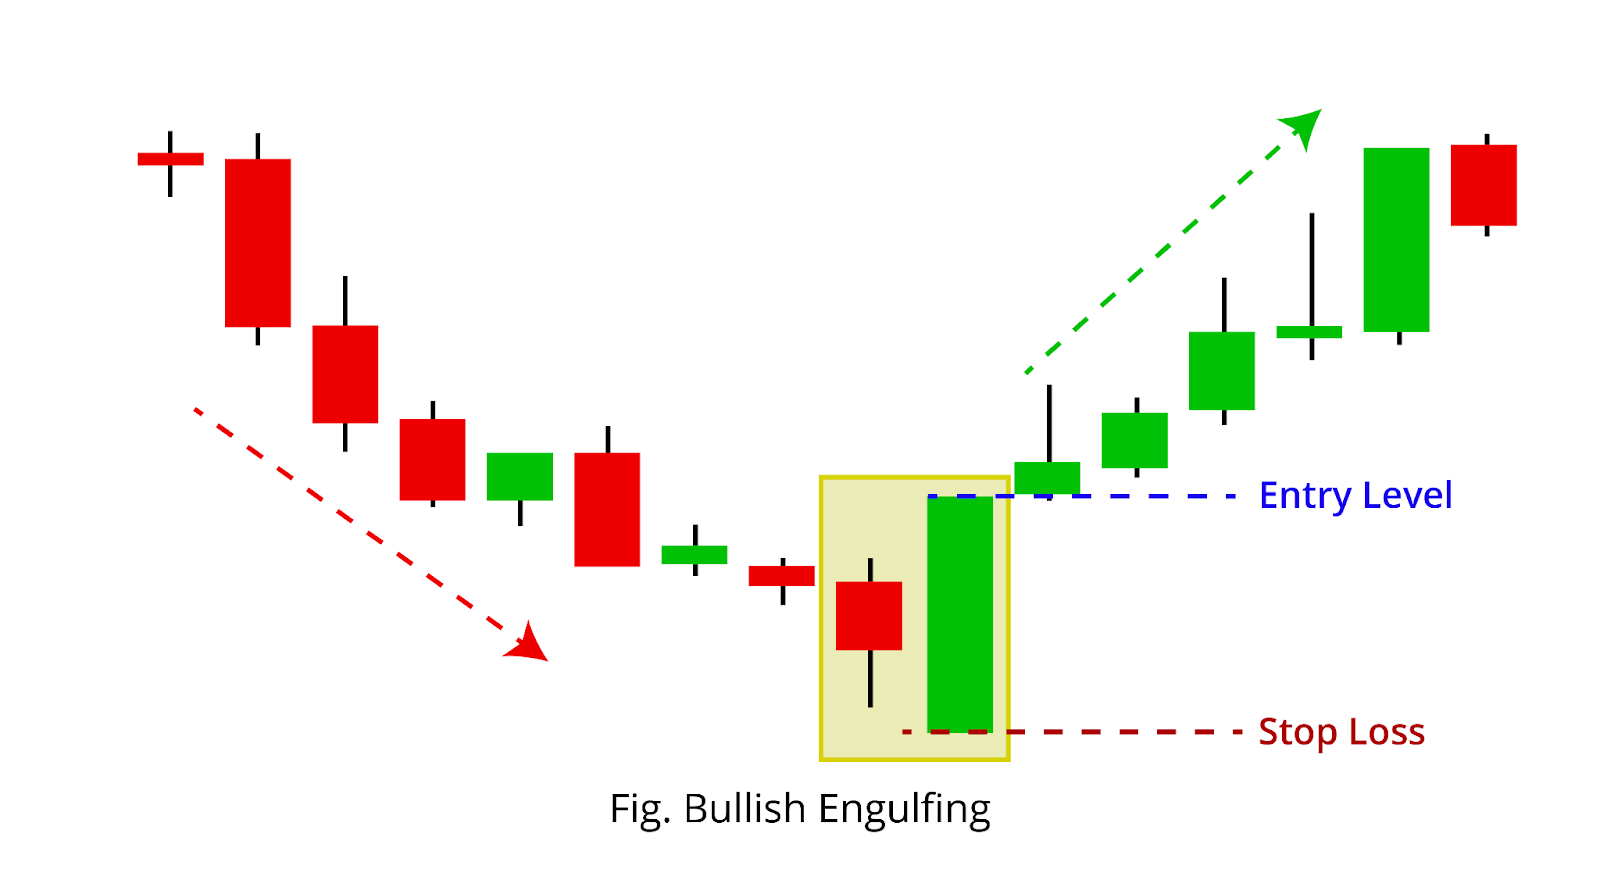
Entry:- Entry is always preferred after the confirmation of the pattern, it can be set at the closing price of the green candle of the pattern formed.

Stop loss:- The stop loss to the position can be placed below the low of the bullish engulfing candlestick pattern. As a part of risk management, trading with stop loss and respecting the logical stop loss is important.
Profit target:- For the long position entered in the engulfing pattern, a target can be based on the risk-to-reward ratio or to the next levels of resistance in the market.
Also read…
Bullish Engulfing Candlestick Pattern – Example
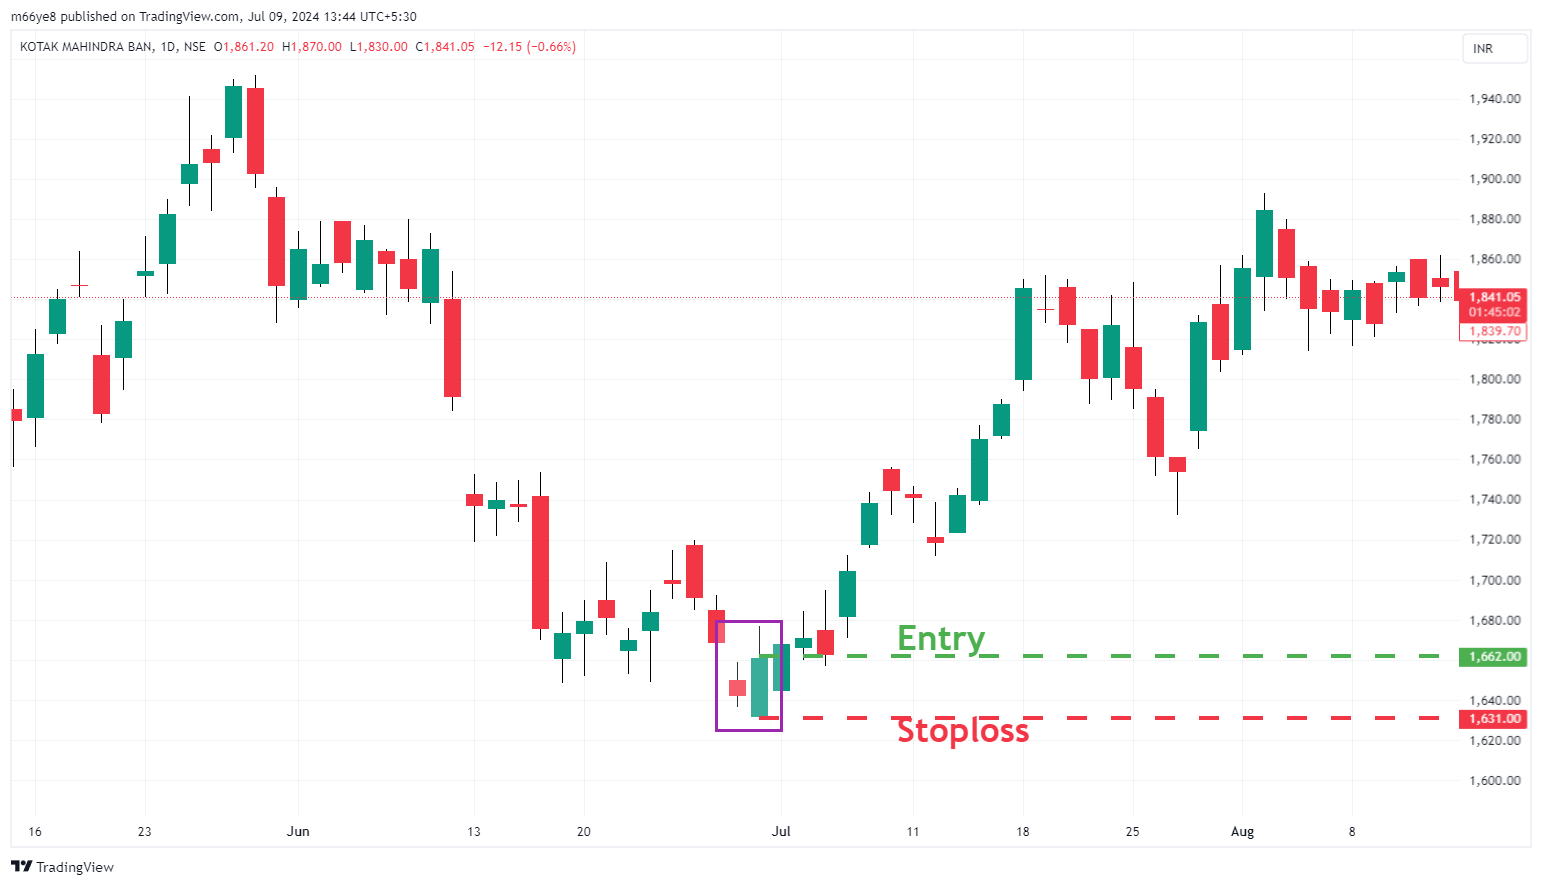
In the chart of Kotak Mahindra Bank, we can observe the formation of a bullish engulfing candlestick pattern at the end of a downtrend. This pattern indicates a significant shift in market sentiment. As discussed in this article, after the bullish engulfing pattern formed, the price transitioned from a bearish trend to a bullish one.
At the time of the formation of this pattern, a trader could have taken a long position when the price of the stock started trading above Rs. 1662.00 and the stop loss was at Rs. 1631.00.
Limitations
The bullish engulfing candlestick pattern signals a powerful reversal. However, it is not always accurate. Traders should also be aware of its limitations.
- The effectiveness of the pattern may vary depending on market conditions, it can be more reliable in trending markets than in range-bound markets.
- Low volume during the occurrence of the pattern can reduce the reliability of the signal.
- Without a valid pattern formation and confirmation, false identification of a pattern leads to false trade.
Conclusion
From our discussion, it is clear that the bullish engulfing pattern is a significant signal in technical analysis. This pattern indicates a strong bullish reversal, suggesting that buyers are taking control of the market.
Before entering a trade based on the bullish engulfing pattern, traders should follow specific rules to ensure a valid pattern formation. It is crucial to confirm the pattern’s validity by combining it with other technical analysis tools, such as indicators, chart patterns, and candlestick patterns. For profitable trades in the long run follow the learnings with good risk management of the positions.
Written by Deepak
By utilizing the stock screener, stock heatmap, portfolio backtesting, and stock compare tool on the Trade Brains portal, investors gain access to comprehensive tools that enable them to identify the best stocks, also get updated with stock market news, and make well-informed investments.

Start Your Stock Market Journey Today!
Want to learn Stock Market trading and Investing? Make sure to check out exclusive Stock Market courses by FinGrad, the learning initiative by Trade Brains. You can enroll in FREE courses and webinars available on FinGrad today and get ahead in your trading career. Join now!!