


Traders rely on technical analysis to analyse and predict the future movement of the price in the market. Candlestick patterns are a part of technical analysis preferred by traders to understand and predict the future price movement in securities. Here in this article, we will discuss the bullish harami cross candlestick pattern with its meaning, formation, and how to set up a trade with the pattern formation.
Bullish Harami Cross Candlestick Pattern – Definition

The bullish harami cross candlestick pattern is a two-candlestick pattern that indicates a potential bullish reversal in security. This pattern consists of a large bearish candlestick (red candle) followed by a doji candlestick.
The doji candle in this pattern is formed within the body of the previous red candle. This means that the high and low prices of the doji candle are within the open and close price range of the first candle. It is preferable for the prior trend of the security to be a downtrend and its appearance after it would give a better indication of the bullish reversal.
Bullish Harami Cross Candlestick Pattern – Meaning
As the bullish harami cross candlestick pattern indicates a bullish reversal, it is preferable to appear during a downtrend. Here, the first candle formed in this pattern is a long red candle which indicates a strong selling pressure present in the security.
Note: If you want to learn Candlesticks and Chart Trading from Scratch, here’s the best book available on Amazon! Get the book now!
This is followed by the second candle opening higher than the close price of the first candle.
Here, the opening and closing prices of the second candle will be close to each other, forming a doji candle. Moreover, in that duration, the price of the stock does not go below the close price of the first candle nor go above the open price of the first candle.
The formation of a doji in the bullish harami cross indicates that there is equal buying and selling pressure thus signalling indecision in the market. Due to this indecisiveness, participants might start booking their profits.
Strengths Of The Pattern
There are a few situations where the formation of the Bullish Harami Cross candlestick pattern gives a stronger bullish reversal indication.

- If it is formed near a support zone: The formation of this pattern near a support zone is a strong indication that the price of security will go up. This is because there would already be multiple buy orders at that zone and the formation of this pattern will bring in more buyers as well.
- If it is formed with the RSI also being in an oversold zone: This is a strong indication as the RSI being in an oversold zone and the formation of this pattern indicates more buyers in the market. Hence the price might see an upward momentum.
Bullish Harami Pattern and Bullish Harami Cross Pattern – Difference
In the bullish harami candlestick pattern, the second candle formed is a proper green candle which is formed within the body of the first candle. Whereas the second candle is a doji candle in the bullish harami cross candlestick pattern.
The formation of a bullish harami candlestick pattern gives a slightly stronger bullish reversal indication as the second candle formed in that candle is a proper green candle which shows that there was higher buying pressure whereas the Doji indicates equal buying and selling pressure.
Bearish Harami Cross Candlestick Pattern – Trading Ideas
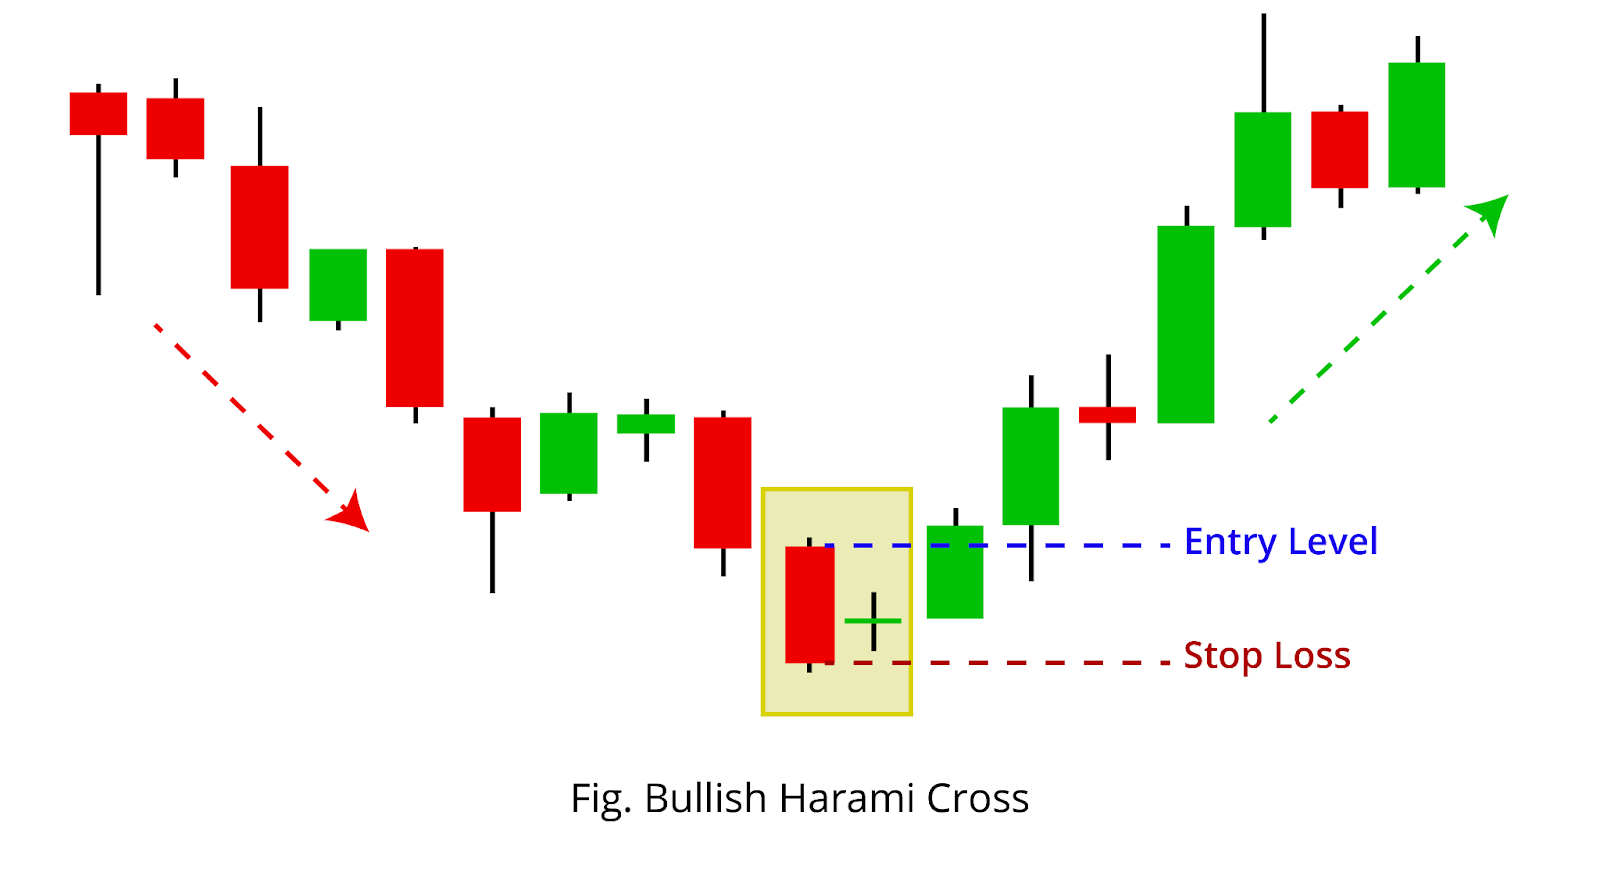
- ENTRY: When the price of the security goes above the open price of the first candle in this pattern, traders can take a buy entry.
- TARGET: Traders can exit the trade when the price of the security reaches near the immediate resistance zone. Once this level is reached, they can also book partial profits in the trade and hold on to the remaining position until the next resistance level.
- STOP LOSS: Traders can place the stop loss near the close price of the first candle in this pattern.
Bullish Harami Cross Candlestick Pattern – Example
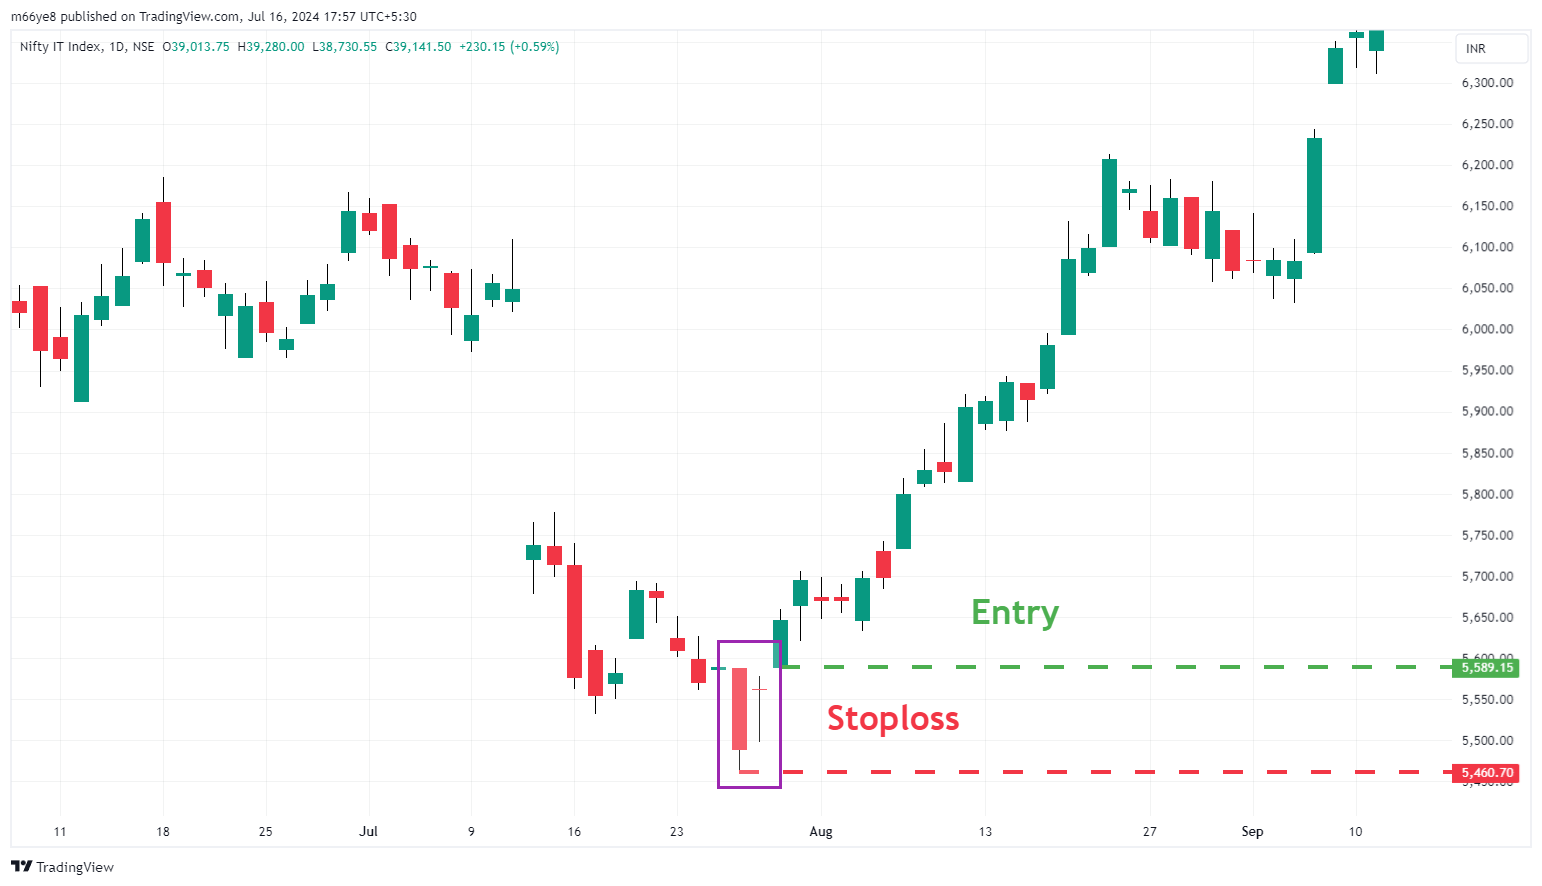
In the above chart of the Nifty IT Index, the time frame is 1 day. The two candles enclose is the bullish harami cross candlestick pattern.
As you can see, the pattern was formed at the end of the downtrend and the price went into an uptrend after the formation of this pattern. Traders could have taken a buy entry at Rs. 5589.15 and the stop loss was at Rs.5460.70.
Also read…
Combining the Bullish Harami Cross Candlestick Pattern with RSI Indicator
Traders can combine the formation of a bullish harami cross candlestick pattern with the RSI indicator to get an even stronger indication of a trend reversal. If the RSI is also at an oversold zone when this pattern is formed, this is a stronger indication of bullish momentum than just the formation of this pattern. So if both indicate a bullish momentum, traders can take a buy entry.
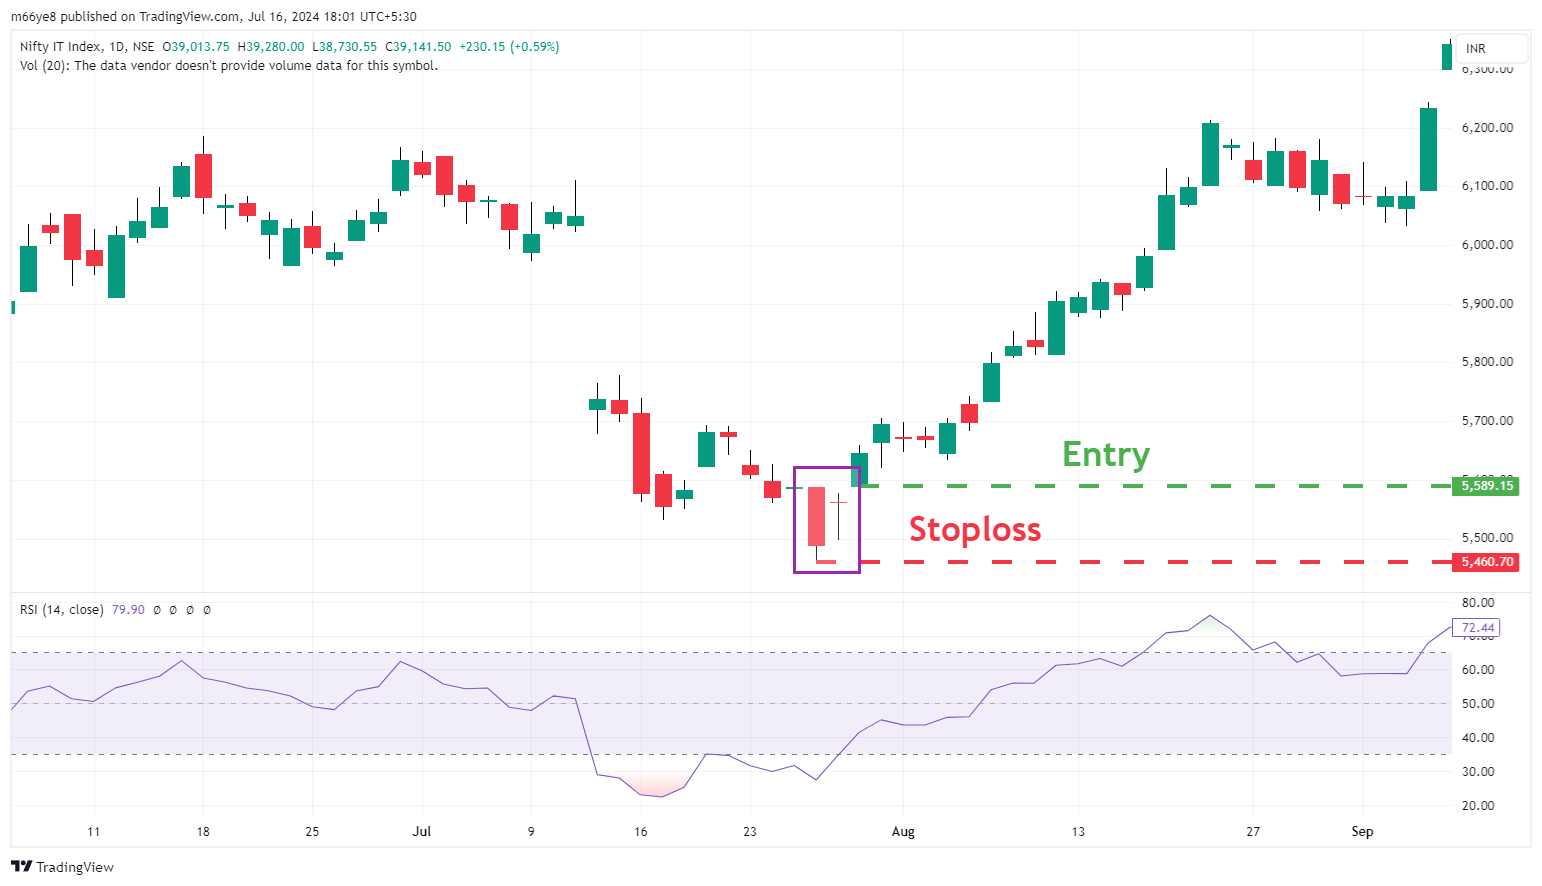
As you can see in the above chart of the Nifty IT Index, the RSI was also at an oversold zone when the pattern was formed and the price went up as indicated. This would’ve been a stronger indication and a confirmation for the traders when this pattern was formed.
Conclusion
In this article, we understood what a bullish harami cross candlestick pattern is, its meaning, its characteristics, and how a trader can take a trade. A bullish harami cross gives a strong bullish indication and the trader can couple it with the RSI indicator to confirm its bearish movement.
To minimize potential losses, traders are advised to place appropriate stop-loss orders when executing trades, in case the market moves against the analysis.
Written by Deepak
By utilizing the stock screener, stock heatmap, portfolio backtesting, and stock compare tool on the Trade Brains portal, investors gain access to comprehensive tools that enable them to identify the best stocks, also get updated with stock market news, and make well-informed investments.

Start Your Stock Market Journey Today!
Want to learn Stock Market trading and Investing? Make sure to check out exclusive Stock Market courses by FinGrad, the learning initiative by Trade Brains. You can enroll in FREE courses and webinars available on FinGrad today and get ahead in your trading career. Join now!!